
In order to represent the full state of a quantum system we need to keep track of at least 2 things:
- The full state of each qubit
- The existing correlations between groups of qubits
Note that the correlations between qubits can exist for groups larger than 2. It is really tempting to think that you can describe them as correlations between pairs of qubits but even if we use a combination of 2-qubit gates in order to entangle, for example, 3 qubits you will end up with a correlation that connects the 3 qubits as a group.
In this post, we will explore one way to represent a quantum state using graphs and more generally, hypergraphs.
What is a Hypergraph?
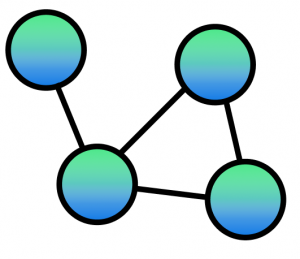
The name is fancy but the concept is simpler than you think. You might already be familiar with graphs or networks but if not, don’t worry. The basic idea of a graph is simple: A set of nodes and edges that connect pairs of nodes. Here an example:
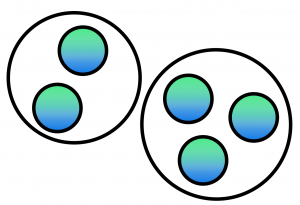
If we extend this definition by allowing edges to connect 2 or more nodes we then have a hypergraph. We can graphically represent the (hyper-)edges using circles around the elements that belong together:
What is a Quantum Correlation?
Quantum systems exhibit many types of correlations both quantum as well as classical. Entanglement is the most well-known but there are other types such as quantum discord. For the sake of quantum computation, we will only focus on entanglement.
In general, If we think about 2 systems being correlated, we can typically interpret it as how much information does one of the systems tell me about the other. This also applies to classical systems although we are going to leave the difference between the quantum and the classical world for a later post.
This way of describing a correlation makes it particularly easy to use graphs in order to represent 2-qubit entanglement. Simply use the nodes to represent possible qubit states, and connect the nodes which are correlated. If a system has no entanglement then the corresponding graph will have no edges, just one node per qubit.
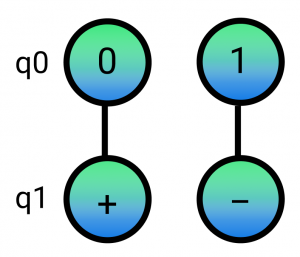
The graph above represents a state where 2 qubits are entangled. If q0 (qubit 0) is measured to be in the 0 states, then we can determine that q1 (qubit 1) will be measured to be in the + state. Note that I am using a very simplified notation here omitting kets and normalized amplitudes for the sake of simplicity. We’ll get more formal in future posts.
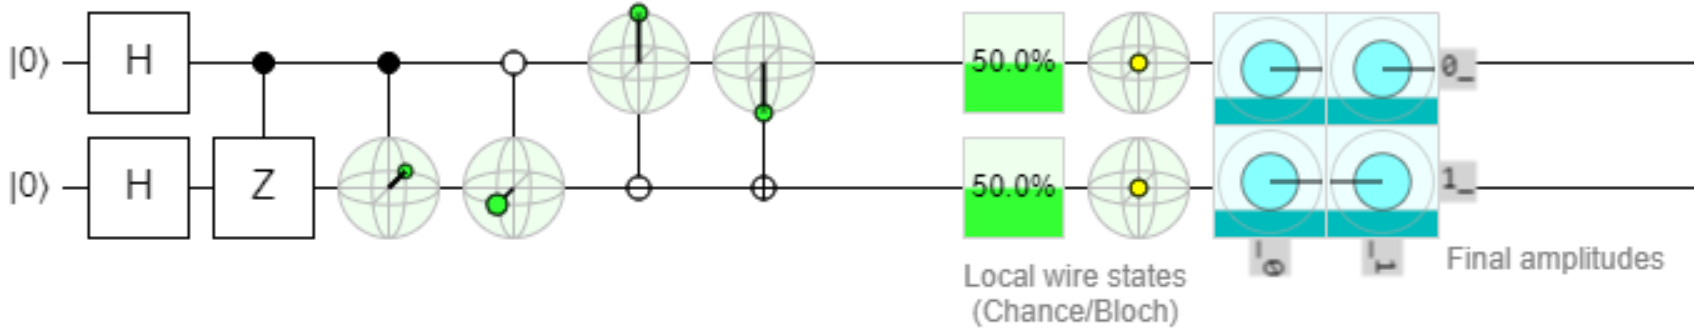
You can play with the Quantum circuit that corresponds to this graph in Quirk:
The Bell State Hypergraph
In the next post, we will explore how can we operate directly on these types of representations and let the quantum system evolve. We will see how to map one and two-qubit operations to hypergraph transformations and how intuitive these turn out to be especially for the controlled operations discussed in the previous post.